Morning Star Candlestick Pattern
There are many patterns and indicators that you could use to figure out the right time to enter a trade. One can come across various patterns while trading in the stock market. A few examples of patterns are Head and Shoulders, Cup and Handles, Wedges, Flags, Morning Star, Evening Star, etc. Out of all of these, today we will learn what the morning star candlestick pattern is.
Table of Contents
What Is a Morning Star Candlestick Pattern?
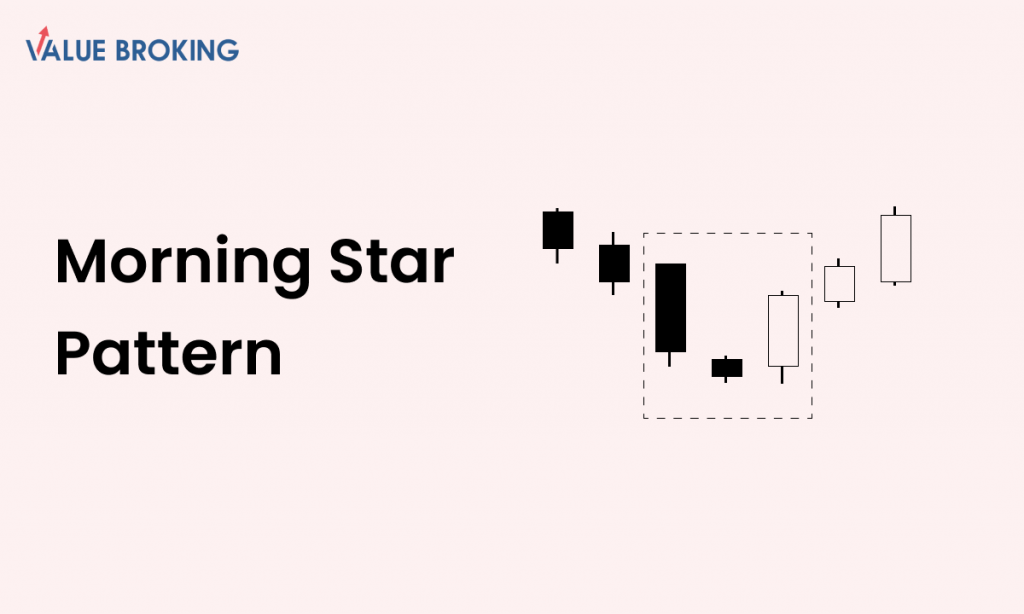
A morning star candlestick is a reversal pattern seen at the end of a downtrend, consisting of 3 candlesticks.
- The first candle is red, signifying a high opening point with a lower closing point.
- The second candle is generally a Doji candle with almost the same opening and closing prices.
- The 3rd and last candle is a green candle with a lower opening point and a higher closing point.
So the candlestick morning star pattern helps understand when the market trend and investor sentiment changes. Like the morning star pattern, an opposite effect is known as the evening star candlestick pattern also exists. It occurs when the uptrend is broken, and a bearish market begins. They are the morning and evening stars because they look similar to a sun rising and setting between the hills. They signify a change in the market sentiment.
What Does a Morning Star Tell You?
A benefit of the morning star pattern is that it’s a visual pattern. All you need to do is look out for it in a downtrend instead of crunching any numbers. The morning star pattern conveys the changing sentiment of its investors. It indicates the beginning of a bullish trend after a bearish one in the market or for a stock.
The market might be following a downtrend for a while now. After some time during the ongoing downtrend, many investors believe and feel that the market might reverse soon. This sentiment is finally visible by a Doji candle. The Doji candle signifies equal and significant buying pressure compared to the selling pressure in the market. This bullish sentiment is later confirmed by the 3rd candle, which is a bullish candle and is significantly higher compared to the Doji candle.
An Example of How to Trade a Morning Star
As an investor looking to profit, one must use the morning to your advantage. You must use other indicators too with this. A rough example could be a share price initially at 500 and is undergoing a downtrend. Say today; it closes at 105. The next day there is a considerable price fluctuation as the share price opens at 105, but when the market closes, it is at 100, giving rise to a Doji candle. In the coming day, the share price opens at 110 and keeps rising, and closes at about 175.
To ensure a position at the beginning of the uptrend, you may want to enter the trade; You may also buy somewhere close to the day’s end, like about 160 or 165. It would simply be positioned to earn significant profits to maximise returns as the market continues in a bullish trend.
The Difference Between a Morning Star and a Doji Morning Star
Doji originates from the Japanese language. In Japanese, Doji means a mistake or blunder. In a trading session, a Doji candlestick occurs when there’s indecision in the market. It looks more like a cross as the opening and closing prices are virtually equal. The wick sizes can differ, giving rise to 5 different Doji candles. Each Doji has its meaning, but they all signify a situation where the opening and closing prices of the market are equal.
The five types of Doji candles are –
Standard Doji
On a chart, it looks like a plus sign. This Doji forms when both buying and selling pressure is equal, and the horizontal line is close to the midpoint of the legs of the Doji candle.
Long-legged Doji
It’s like a standard Doji candle, the vertical lines being the only exception that are quite significant. It means that trades are pretty indecisive of where the market should go leading to a massive change in price.
Dragonfly Doji
These generally appear at the bottom of downtrends signaling a change in trend. The horizontal line is generally at the top or very close to the top, forming a “T.” The Dragonfly Doji is a bullish indicator suggesting the market will be bullish going forward.
Gravestone Doji
The gravestone Doji looks like an inverse Dragonfly Doji. It is close to the bottom on the vertical, generally stating that the buying power wasn’t enough to sustain for long. The Gravestone Doji is an indicator of a downtrend. If the market has been going in a downtrend, the downtrend is more likely to continue. On the other hand, an uptrend is likely to reverse after a Gravestone Doji appears.
4 Price Doji
A 4 price Doji is a single horizontal line. It indicates that neither the buying nor the selling power beat each other at any single point in time. It is a unique Doji indicating either uncertainty or very little activity to change the price.
The one difference between a Doji Morning star and a normal morning star is the size of the middle candle. The middle candle usually opens and closes at different prices giving rise to a normal morning star pattern. The Doji Morning star candlestick part has a Doji in the middle, signifying the change in sentiment.
The Difference Between a Morning Star and an Evening Star
Morning Star | Evening Star |
| Appears at the end of a downtrend | Appears at the end of an uptrend |
| Consists of three candlesticks | Consists of three candlesticks |
| The first candlestick is a long bearish candlestick | The first candlestick is a long bullish candlestick |
| The second candlestick is a short candlestick (either bullish or bearish) with a small body and a gap from the first candlestick | The second candlestick is a short candlestick (either bullish or bearish) with a small body and a gap from the first candlestick |
| The third candlestick is a long bullish candlestick | The third candlestick is a long bearish candlestick |
| Signals a potential reversal of the downtrend | Signals a potential reversal of the uptrend |
| Indicates that buying pressure may overcome selling pressure | Indicates that selling pressure may overcome buying pressure |
Limitations of Using the Morning Star Pattern
When using the Morning Star pattern as a trading signal, it’s important to consider its limitations:
- False signals: Not all Morning Star patterns lead to a significant reversal. Sometimes, the pattern may fail to produce the expected price movement, leading to false signals.
- Confirmation required: While the Morning Star pattern indicates a potential trend reversal, it’s advisable to wait for additional confirmation signals before making trading decisions. This confirmation could come from other technical indicators or candlestick patterns.
- Market context: The Morning Star pattern should be analyzed within the broader market context. It’s essential to consider factors such as overall market trends, volume, and other relevant technical indicators to validate the pattern’s significance.
- Whipsaw movements: In volatile markets, the Morning Star pattern may result in whipsaw movements, where the price reverses briefly before resuming its original trend. Traders should be cautious and consider the overall market conditions before relying solely on this pattern.
- Timeframe sensitivity: The effectiveness of the Morning Star pattern may vary across different timeframes. It’s crucial to test and validate its reliability on the specific timeframe used for trading.
- False positives: Sometimes, other candlestick patterns or indicators may resemble the Morning Star pattern, leading to false positives. Traders should be careful not to mistake similar patterns for the Morning Star and make hasty trading decisions based on those signals.
Conclusion
While the Morning Star pattern can provide valuable insights into potential trend reversals, it is essential to use it in conjunction with other technical analysis tools and consider the limitations mentioned above. Traders should exercise caution, conduct a thorough analysis, and apply risk management strategies to make informed trading decisions.